Example 1: Fluorescent stain measurement
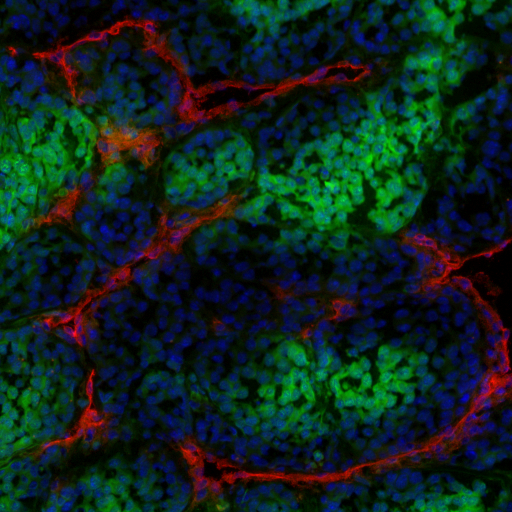
Fluorescent wide field image of three fluorescent markers/stains:
- Blue: DAPI nuclear marker
- Red: Marker for wounding
- Green: Cytoplasmic marker for healthy cells.
Aim
Analyse the area covered and/or intensity of marker for wounding.
1. Open "[...]/Images/Widefield/Fluorescence Measurement/Fluoro 01.tif"
2. Calibrate the image:
Image → Properties
Unit of length: µm
Pixel width: 0.6
Pixel height: 0.6
Voxel depth: 1
Calibration are usually encoded in the image metadata in modern microscopes
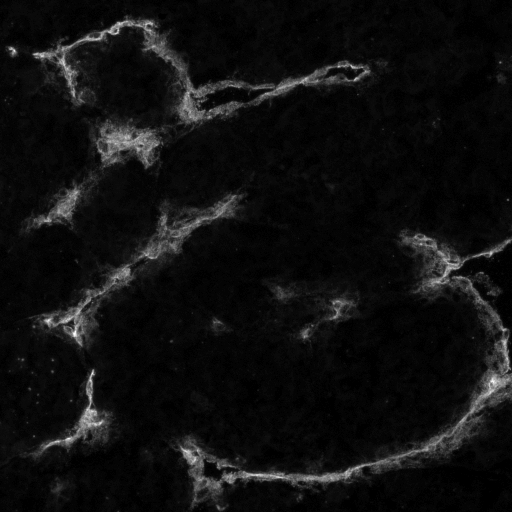
3. Split channels so we can do measurements on a specific channel.
Image → Colour → Split Channels
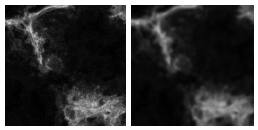
Filtering
4. Apply a Gaussian Blur with a sigma of 1 px to reduce noise.
Process → Filters → Gaussian Blur...
A Gaussian blur filter helps to smooth noise that is typically present in images acquired with highly sensitive camera sensors or detectors.
Segmentation
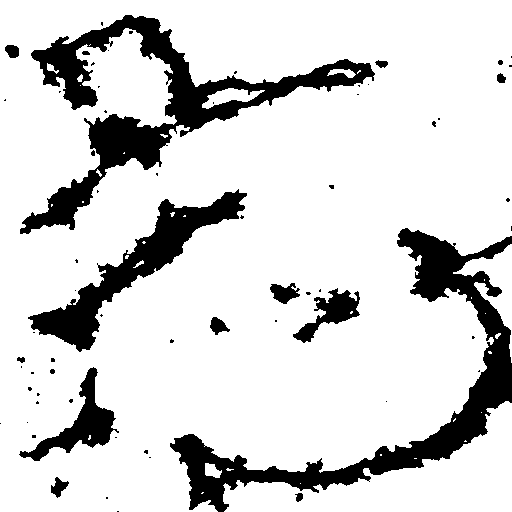
5. Threshold based segmentation:
Image → Adjust → Threshold...
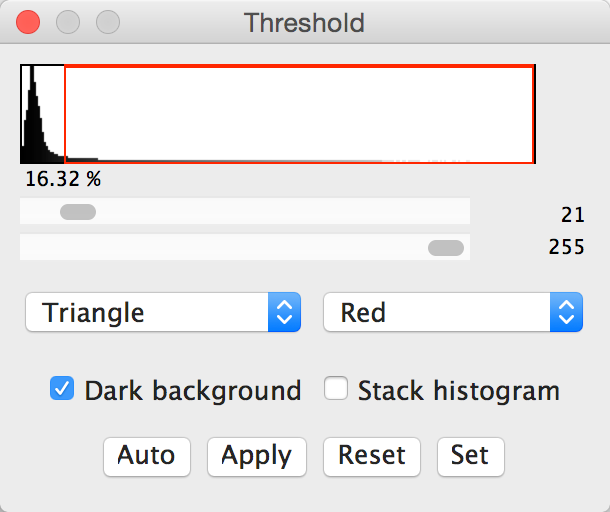
Thresholding segments the images based on pixel intensity. Thresholds can be set manually or automatically via algorithms that examine the image histogram.
Measurement
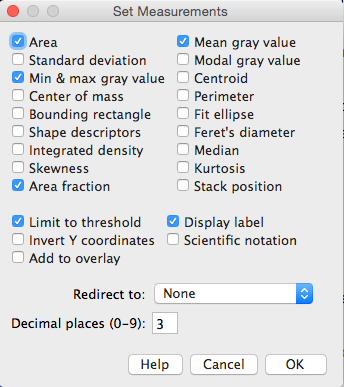
6. Set measurement types:
Analyze → Set Measurements...
Tick: Area, Min & max grey value, Mean grey value, Area Fraction, Limit to Threshold, Display label
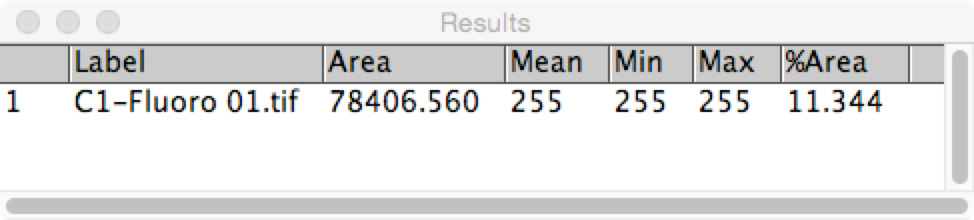
7. Measure:
Analyze → Measure
Here we are measuring the cumulative area of all stained parts. In the next example, we will utilise connected components to analyse the characteristics of individual segmented regions.